Exploring the machines and data in the factory
Once the CloudFormation template has completed successfully you can start the workshop using the following steps.
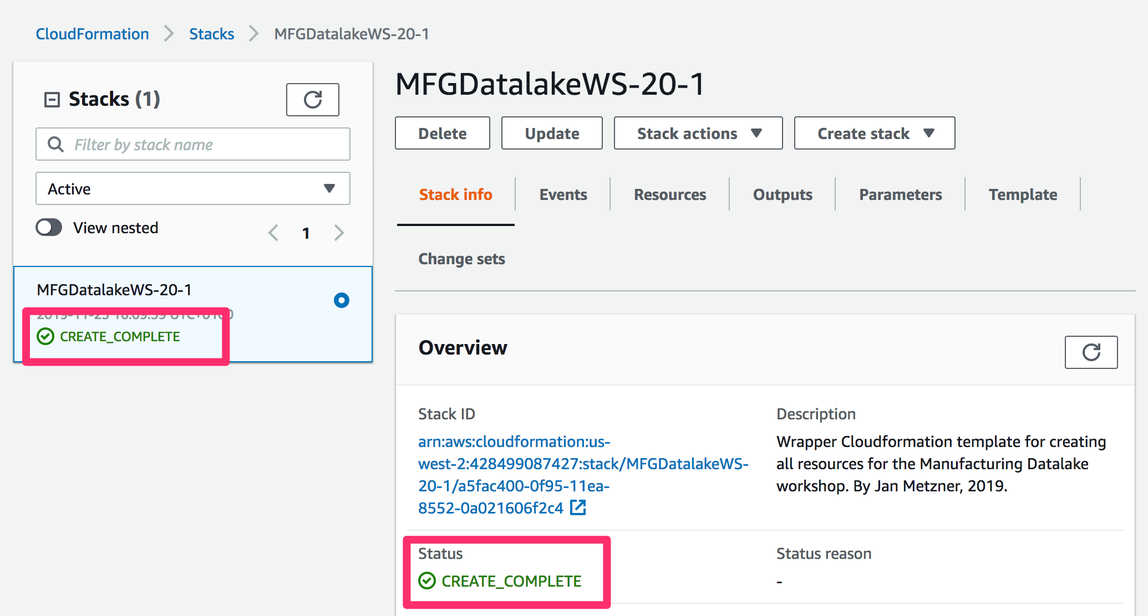
Note: The CloudFormation template has finished once the status of the root stack has changed to CREATE_COMPLETE as shown below:
In the “Outputs” tab, you will find an output called “WorkshopBucket”, which contains the name of the S3 bucket used to store various files necessary for this workshop.
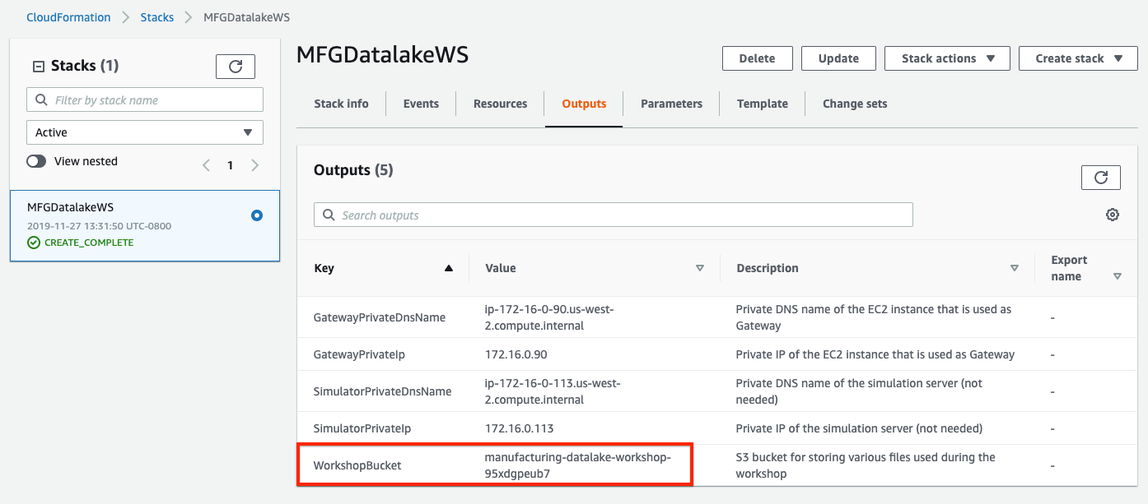
Please keep the window/tab with this output open and open another browser tab within the AWS console for the account where the CloudFormation template has been deployed.
We will use this new tab to do the workshop work and keep the CloudFormation tab open for reference of the name of the bucket when needed.
For the workshop lets assume a scenario where the plant manager has given you the following network diagram which shows the IP addresses of the different PLCs and you will select one PLC and connect to it.
TODO screenshot/image
Utilising a Gateway Server to connect to the PLCs
In order to explore what’s currently going on within the factory network we will use an industrial PC that is sitting in the DMZ manufacturing network and has access to the factory network. For this workshop the industrial PC (IPC) represented as a EC2 machine where we will also later install the gateway software.
The CloudFormation template has already created this IPC with a basic Linux Operating System (Ubuntu 18.04 LTS) installed on it. To log in to the console of the gateway via SSH, we will use the Session Manager within the AWS Systems Manager service.
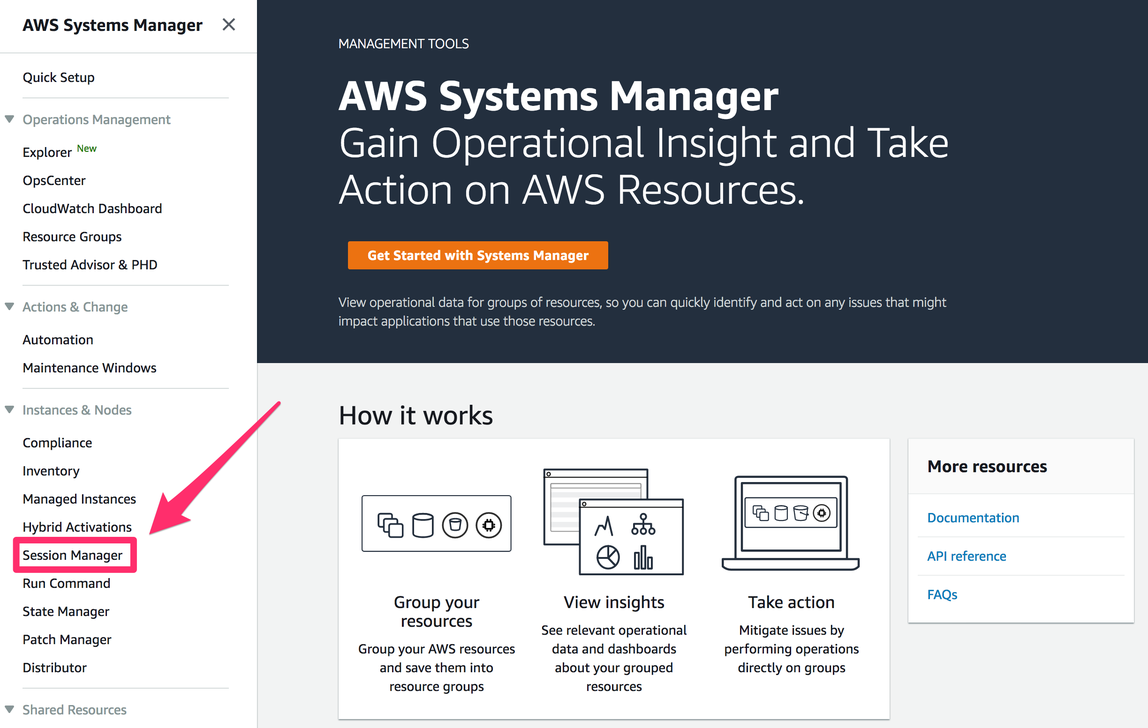
From the AWS console’s top menu click Services > Systems Manager and then in the left-hand menu of the AWS Systems Manager service click Session Manager:
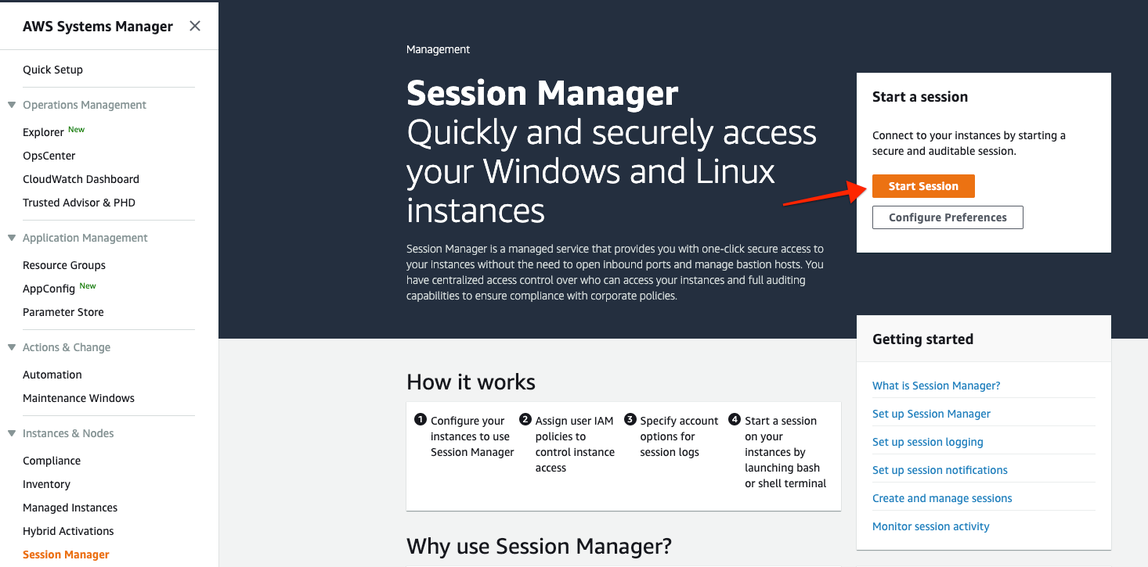
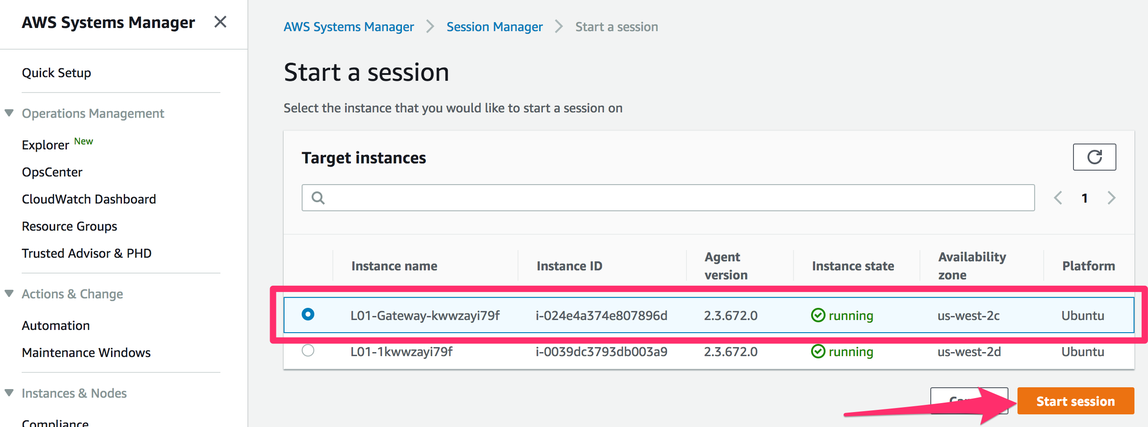
In the Session Manager, click on “Start Session”.
Select the entry where the name starts with “L01-Gateway” and click “Start session” at the bottom right of the screen.
This will open a new browser tab with an SSH shell and the Linux command line of the industrial PC. In an environment not fully-hosted on AWS, this step resembles logging into an industrial PC running Linux using a SSH client such as Putty or Bitvise Tunnelier.
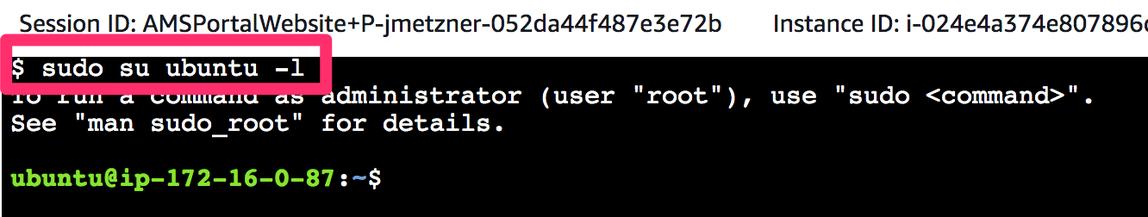
To make things easier for you to work and to have a proper shell, please enter the following commands:
sudo su ubuntu -l
This should result in a bash shell for entering Linux commands with the current directory being the home directory of the user “ubuntu” as shown below:
Explore the data with an OPCUA Client
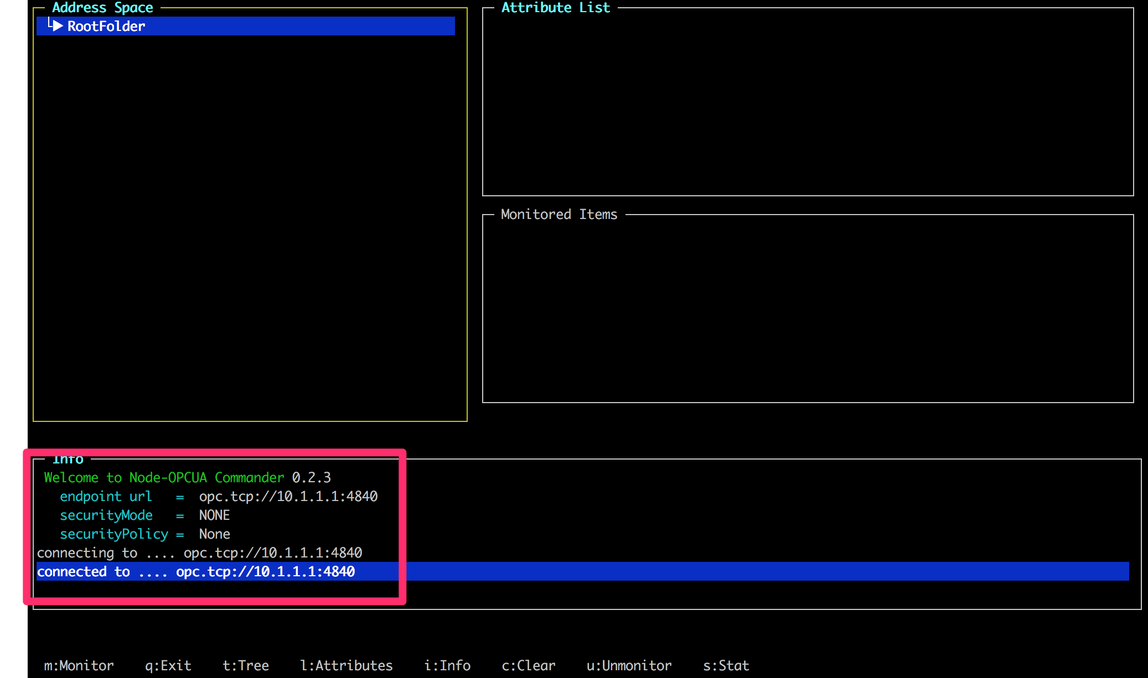
Select a PLC (in this workshop we will pick the first one from S01 with the IP 10.1.1.1) in the production line and note the IP address. Start the opcua-commander tool using the following command typed in the terminal:
opcua-commander -e opc.tcp://10.1.1.1:4840
It is important to note that this is a private IP. This means the traffic between the Industrial PC and the PLC does not traverse the Internet, but only traverses the factory network.
Once opcua-commander has started, the screen should show the following. The status should have a message “connected to...opc.tcp:/10.1.1.1:4840”):
Using the opcua-commander, we can now explore the data exposed by the PLC.
OPC-UA Nodes the PLC which exposes the Telemetry Data
You can drill down into a node that is selected in the OPC-UA tree by pressing the right-arrow key on the keyboard. The currently selected node is the root node of the OPC-UA tree displayed above as “RootFolder”. Pressing the right-arrow key will show that there are 3 child nodes for this root node called “Objects”, “Types” and “Views”. For our purposes, only the node “Objects” is relevant. Drill down into the following path (you can select nodes using the up and down arrow keys):
Objects → 2:ProductionLine → 2:MAIN → 2:S01
This will provide you with 5 child nodes. Select the node “2:State” and press the “m” key on the keyboard to monitor this node and potential value changes. You will see that the data for this node continuously changes as shown in the screenshot below:
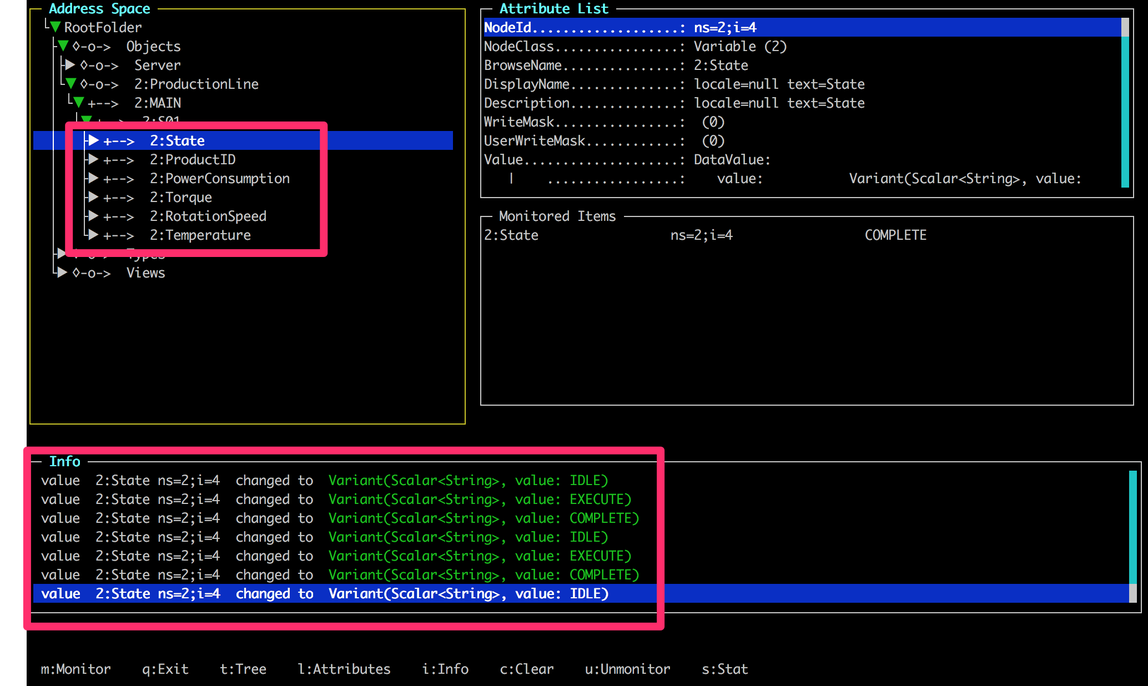
The state changes are due to the machine cycling through the production process. By selecting the nodes for and pressing the “m” key on your keyboard, you should be able to monitor these values as well. This will show you a continuously changing set of values that occurs throughout the manufacturing process. This concludes the exploration of the OPC-UA tree.
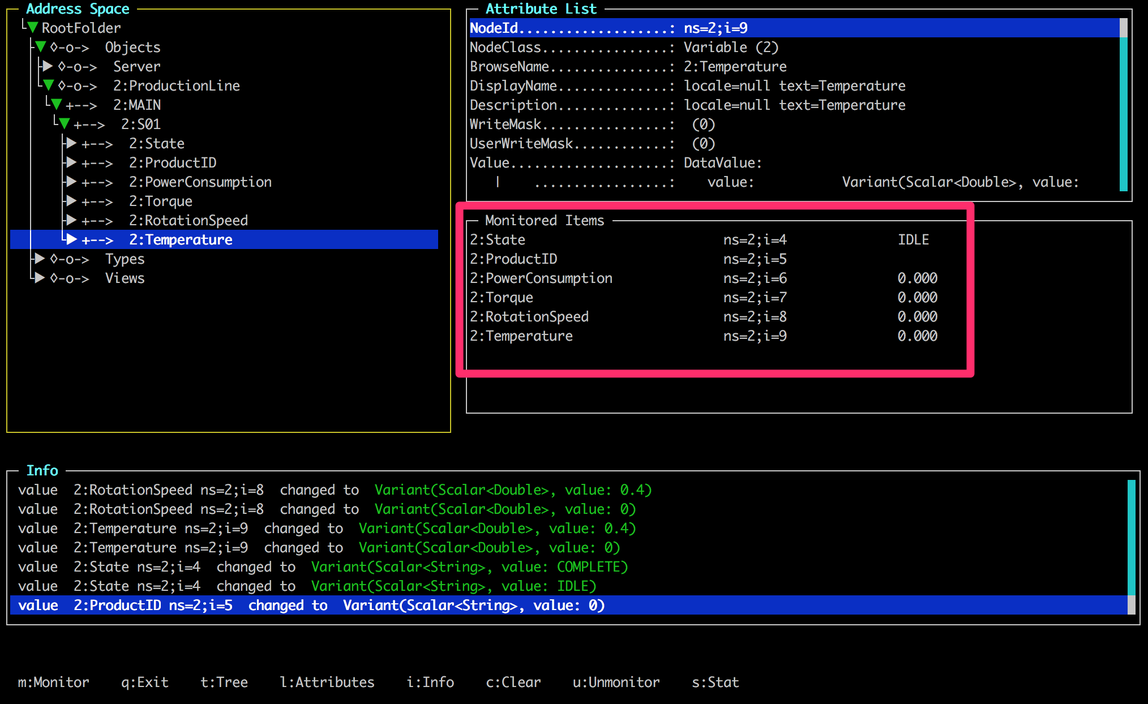
Have a look at the data. For now the important pieces are the following variables:
State- the state of the production station - will go to EXECUTING when a product is going through this stationProductID- this is connected to the RFID reader that reads the id of the product when it’s entering the station - it will be empty when no product is currently in the station
Press “q” on your keyboard to quit the opcua-commander software and return to the command line.
